Business Analytics is only available for US-based partners.
⚠️ Only users with the specific permission have access to these dashboards.
Overview
Business Analytics in Ui.Marketing consists of four reports to help you better gauge your own revenue and sales pipeline. Now you no longer have to wait for a business review or ask someone to pull together the numbers to know where your digital business stands. Your revenue, pipeline, and campaign performance are available whenever you need them.
Also, check out our FAQ page.
Dashboards
Line Item Dashboard
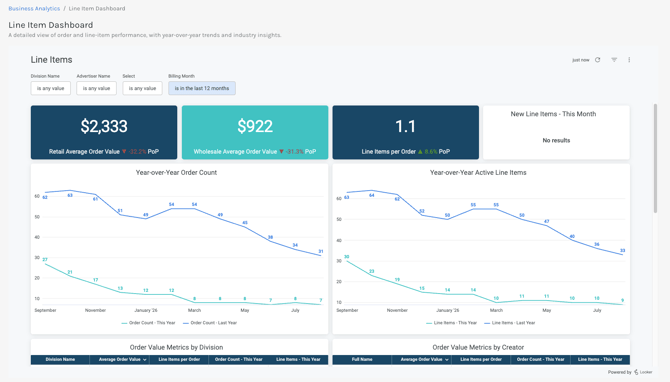
With the Line Item Dashboard, easily see important revenue metrics by order and line item and industry. Easily compare year-over-year metrics , average order values, revenue by industry and much more. To learn more about the specific charts in the Line Items dashboard, click here.
Products Dashboard
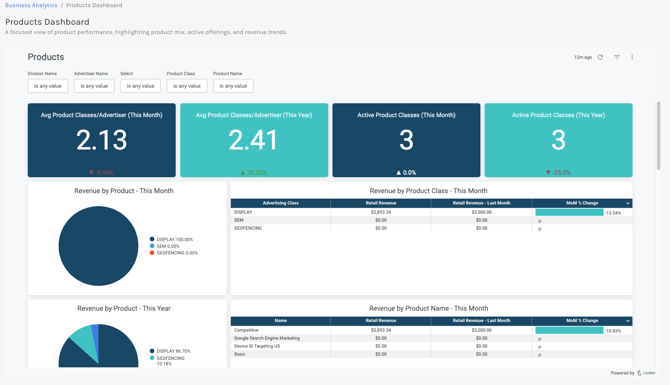
The Product Dashboard allows you help you optimize your product offerings, identify high-margin solutions, and combat product-specific churn. Utilize the monthly and annual revenue mix by product, see your advertiser adoption by product, product churn breakdowns, and much more. To learn more about the specific charts in the Products dashboard, click here.
Proposal Dashboard
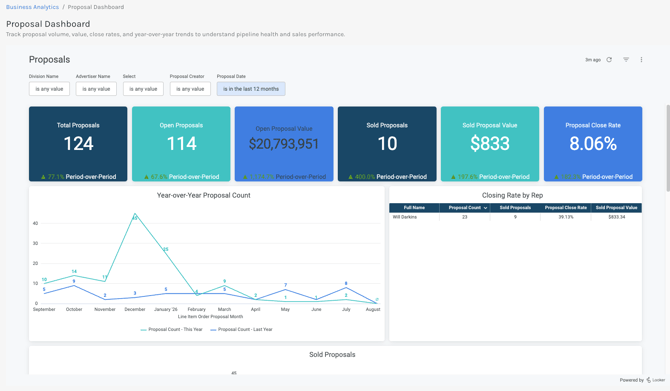
With the Proposal Dashboard get full pipeline visblity and sales team performance tracking to help you optimize close rates and address any pipeline bottlenecks. Track proposal volume trends, close rates by sales rep and division, AI Media Planner adoption, and much more. To learn more about the specific charts in the Proposals dashboard, click here.
Revenue Dashboard
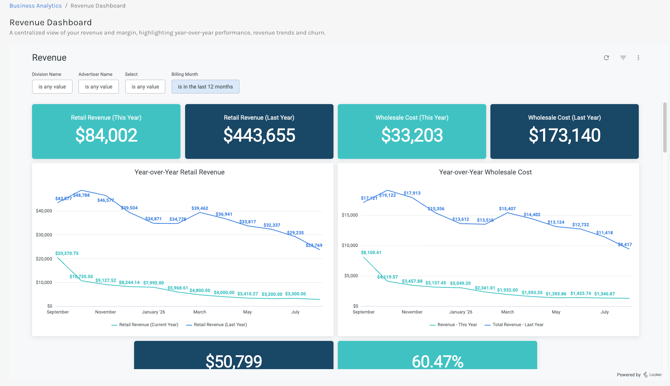
The Revenue Dashboard gives you a macro-level view of overall financial health, margins, and client retention to safeguard profitability. Utilize the revenue vs wholesale cost trends, margin breakdown by division and advertiser, and advertiser churn to find any bottlenecks or your next opportunity. To learn more about the specific charts in the Revenue dashboard, click here.