
The Proposals Dashboard gives leadership complete visibility into your sales pipeline and team performance. Use this dashboard to track proposal volume, evaluate close rates across representatives and divisions, and monitor the adoption of sales enablement tools.
Key Metrics
At the top of the dashboard, you'll find high-level performance indicators that adjust based on your selected date filters. Below is an explanation of these metrics. It is important to note that these metrics change based on the filters and date ranges that you apply.

- Total Proposals: The total number of proposals generated.
- Open Proposals: Count of any proposal that has not been turned into an order.
- Open Proposal Value: Combined retail value of all open proposals.
- Sold Proposals: The total count of proposals turned into an order.
- Sold Proposal Value: Total dollar value of proposals turned into an order.
- Proposal Close Rate: Overall win percentage.
Charts & Reports
Year-over-Year Proposal Count
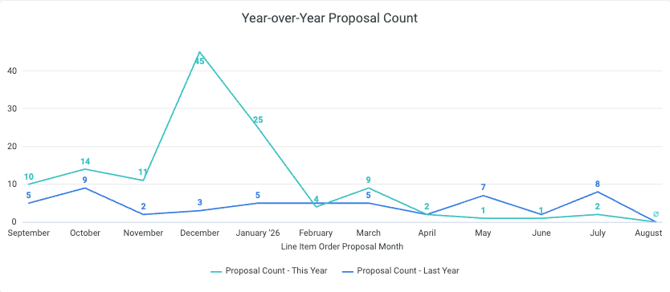
This chart displays new proposal creation counts per month benchmarked against the prior year.
Closing Rate by Rep
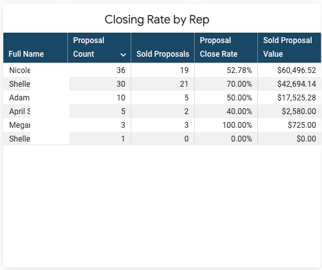
This table shows you the total proposal count, sold proposals, close rate percentage, and sold proposal retail value borken down by your sales representatives.
Sold Proposals
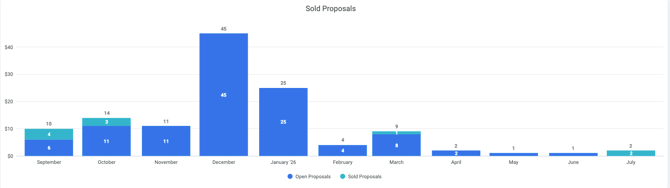
This chart compares new proposals created against sold propsals each month.
Proposals by Rep
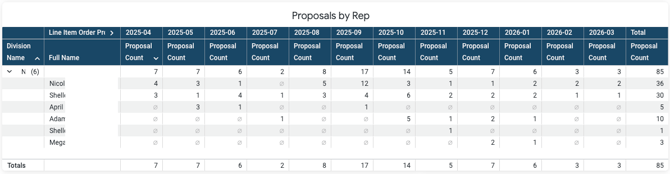
This is a breakdown of sold proposals by division and sales representative over the last 12 months.
Closing Rate by Division
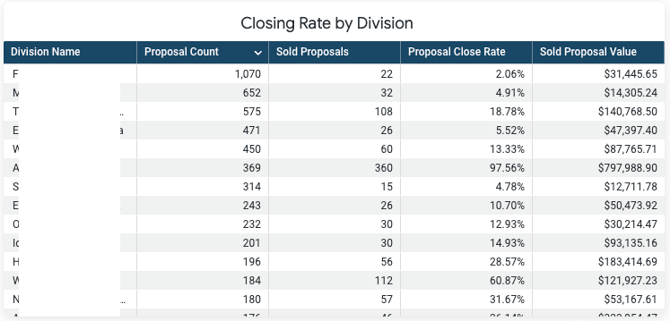
This is a breakdown of total proposals created, sold proposals, close rate percentage, and sold proposal retail value grouped by your organization's divisions.
AI Media Planner Recommendations
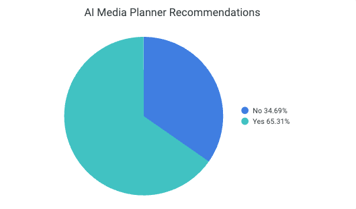
This pie chart tracks the percentage of proposals created that use AI Media Planner's product recommendations feature versus those that add products to proposals manually.
RFPs
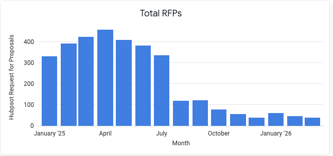
- Total RFPs: This chart displays thetotal Request for Proposals (RFPs) submitted to our team per month.
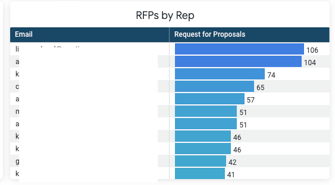
- RFPs by Rep: This chart shows you which sales representatives are submitting the most RFPs to our team.