
The Line Item Dashboard within Business Analytics in Ui.Marketing gives leadership teams deep insight into campaign fulfillment, deal size dynamics, and advertiser order trends. Use this dashboard to analyize order value, identify high-performing industries, and track campaign longevity over time.
Key Metrics
At the top of the dashboard, you'll find high-level performance indicators that adjust based on your selected date filters. Below is an explanation of these metrics.

- Retail Average Order Value: Average retail value of orders placed. This is the amount you charge your clients.
- Average Order Value (AOV) is the total revenue submitted from new orders divided by the total number of orders.
- Wholesale Average Order Value: Average wholesale cost of orders placed. This is the amount that we charge you.
- Line Items per Order: Average number of distinct line items per submitted order.
- New Line Items Submitted: Total number of new line items submitted during the selected date range.
Charts & Reports
Year-over-Year (YOY) Order Count & Active Line Items
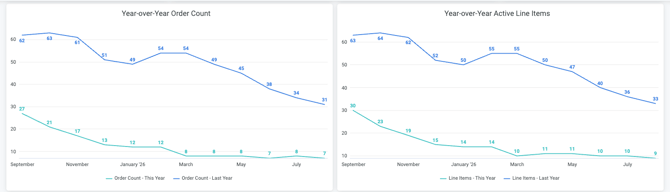
- Year-over-Year Order Count: Compares active order counts over the last 12 months against the prior 12 month period.
- Year-over-Year Active Line Items: Tracks active line item counts monhtly, benchmarked against the prior year.
Order Value Metrics

- Order Value Metrics by Division: Breakdown of the average retail order value, line items per order, order count, and line item count by each division within your organization. This will adjust based on the date filter.
- Order Value Metrics by Creator: The same breakdown of metrics in the Division chart to the left, but broken down by the creator of the line item.
Industry Performance
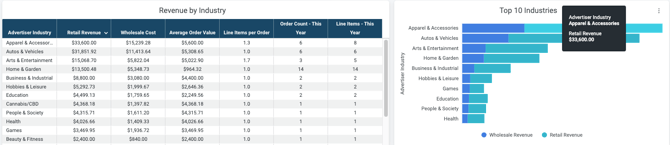
- Revenue by Industry: This table details retail revenue, wholesale cost, retail average order value, line items per order, and 12-month order/line item counts grouped by advertiser inustury.
- Top 10 Industries: This chart highlights the top industries based on retail revenue and wholesale cost over the past year or what ever date range you have selected.
Retail Average Order Value
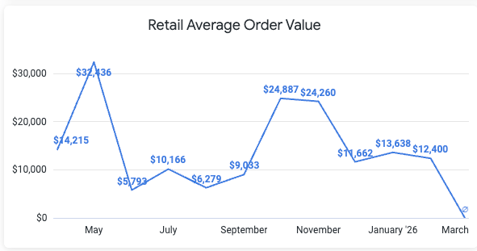
This chart displays your average order value by month to help you identify trends over the past year or what ever date range you have selected.
Average Line Item Duration in Months
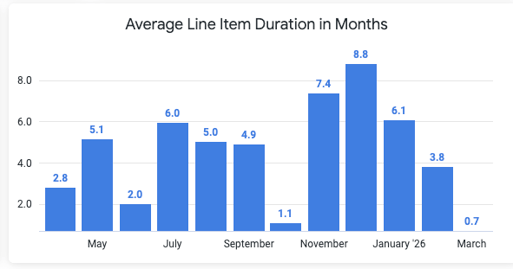
With this chart, you can see the average lifespan (in months) of line items submitted each month over the last 12 months or what ever date range you have selected.