
The Products Dashboard gives leadership a focused view of product performance across your active offerings. Use this dashboard to evaluate product mix, track revenue trends, analyze margin profitability by product class, and pinpoint product-level churn.
Key Metrics
At the top of the dashboard, you'll find high-level performance indicators that adjust based on your selected date filters. Below is an explanation of these metrics.

- Average Product Classes per Advertiser (This Month & This Year): Displays the average number of unqiue product classes utilized per advertiser for the current month and over the last 12 months.
- Active Product Classes (This Month & This Year): Displays the total count of product classes sold across your entire organization for the current month and the last 12 months.
Charts & Reports
Revenue by Product
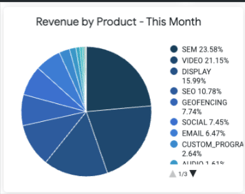
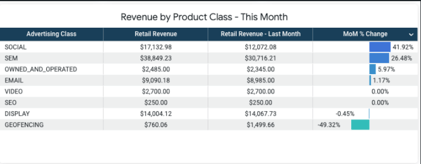
- Revenue by Product - This Month (Pie Chart): This is a visual breakdown of which product classes have the most retail revenue for the current month.
- Revenue by Product Class - This Month (Table): The table allows you to compare retail revenue for this month and compare it to retail revenue last month, and shows you the month-over-month (MoM) change.
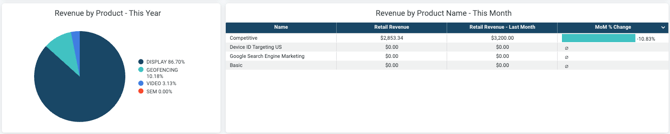
- Revenue by Product - This Year (Pie Chart): This is a visual breakdown of which product classes you have the most retail revenue for this year.
- Revenue by Product Name - This Month (Table): This table shows retail revenue for this month and last month, along with the MoM change for specific products you sell.
Partner Margin by Product Class
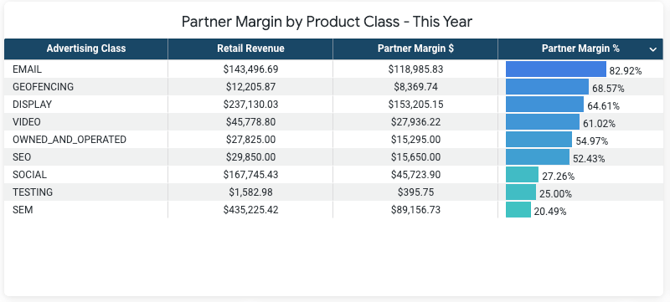
This table shows your retail revenue and margins (profit) in dollars and as a percentage over the last 12 months, or for any date range you select.
Product Usage by Advertiser Count
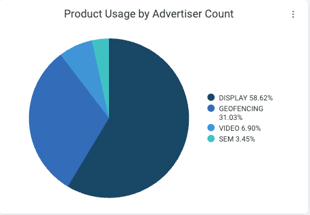 This pie chart shows you the distribution of total advertisers utilizing each product class over the last 12 months or for any date range you select.
Churned Revenue
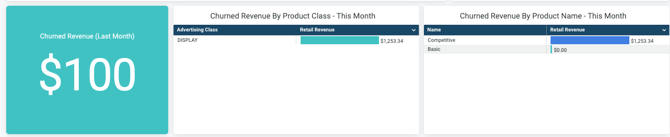
- Churned Revenue (Last Month): This value shows you the total retail revenue from products that rain in the prior month but did not continue into the current month.
- Churned Revenue by Product Class - This Month: This table breaks down the lost retail revenue from last month to this month grouped by product class.
- Churned Revenue by Product Name - This Month: This table breaks down the lost retail revenue from last month to this month by specific product name.
Product Name Revenue
Product Name Revenue by Division

This table outlines the amount of revenue per individual product name running within each division for the current month and the prior month.
Product Name Revenue by Rep

See the amount of revenue by individual product name for each sales representative in your organization. You can see the current month and the prior month's revenue for comparison.
Product Class Revenue by Rep
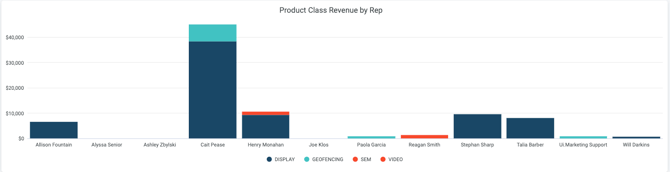
This chart outlines product class revenue by individual sales representative for the current date filter selected. Easily see which reps are selling what types of products.
Partner Margin by Product Class by Month
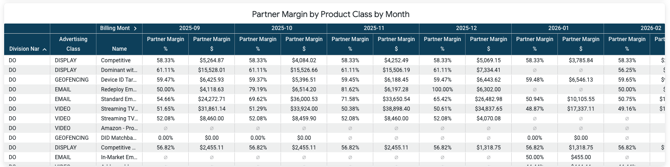
See your margin by product class and by individual product name for each division over the last 12 months.
- Partner Margin subtracts the wholesale billable amount from the retail billable amount for the product. This is the amount that you will profit on the product. These numbers are based on the retail and wholesale rates set in Ui.Marketing.
- Partner Margin % compares the wholesale billing amount to the retail billing amount and is the percent of revenue that you will make.