
The Revenue Dashboard serves as executive leadership’s centralized view of overall financial health, gross margins, and client retention. Use this dashboard to monitor top-line growth, analyze profitability down to the advertiser level, and track customer churn.
Key Metrics
At the top of the dashboard, you'll find high-level performance indicators that adjust based on your selected date filters. Below is an explanation of these metrics.

- Retail Revenue (This Year & Last Year): This is the total retail revenue you have with us for the current and the previous year.
- Wholesale Cost (This Year & Last Year): This is the total wholesale cost for you for the current year and last year.
Charts & Reports
Year-over-Year Retail Revenue & Wholesale Cost
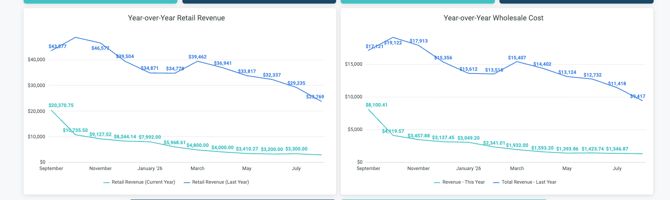
These line charts show you the monthly trends for retail revenue and wholesale cost over the last 12 motnhs benchmarked against the prior 12 months.
Partner Margin
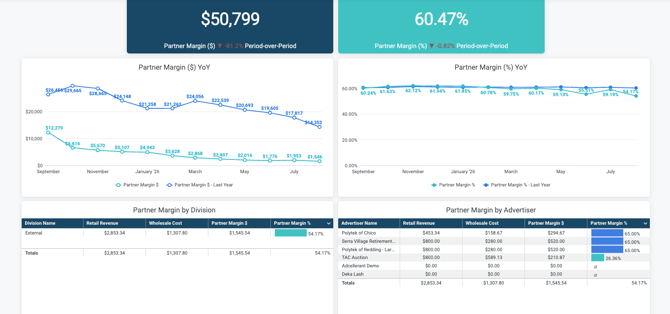
Partner Margin subtracts the wholesale billable amount from the retail billable amount for the product. This is the amount that you will profit on the product. These numbers are based on the retail and wholesale rates set in Ui.Marketing.
Partner Margin % compares the wholesale billing amount to the retail billing amount and is the percent of revenue that you will make.
- Partner Margin (Tiles): We display your margin in dollars and in a percentage format within the two tiles.
- Partner Margin YoY (Charts): We show you your margin by month in both dollars and by percent benchmarked against the prior year.
- Partner Margin by Division: This table comparies retail revenue, wholesale cost, partner margin in dollars, and percentage value by divisions within your organization.
- Partner Margin by Advertiser: Similar to the Division table, this shows you margin by specific advertiser.
Revenue Replacement
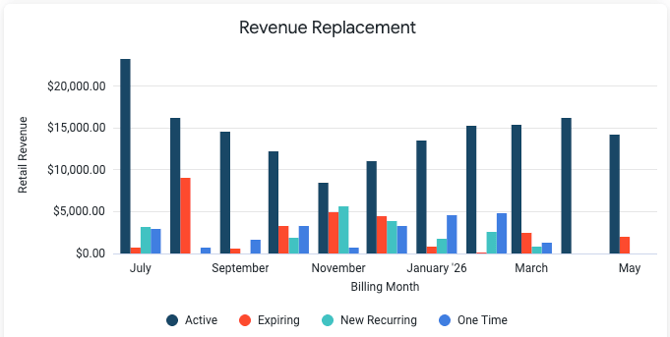
This chart breaks down by month the revenue that is:
-
Active: A line item that will bill in the month and at least one month in the future
- Expiring: A line item that ends in the month
- New Recurring: Any line item that starts in this month and carries at least into the next month
- One Time: Any new revenue that books this month that does not carry into the next month (e.g. an Email campaign)
Month-over-Month Retail Revenue
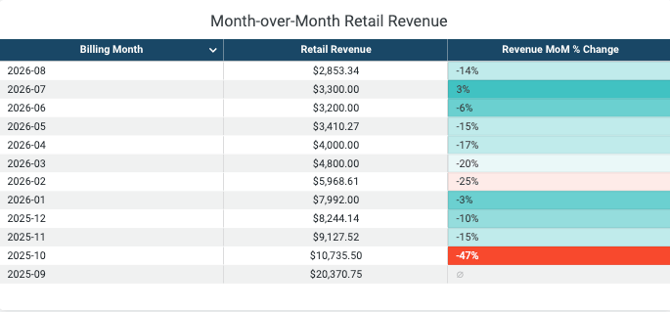
This table illustrates the retail revenue changes MoM.
Retail Revenue by Division
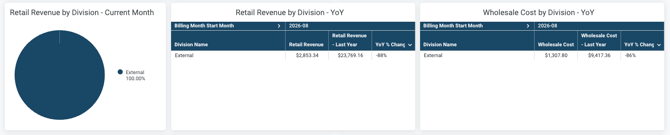
- Retail Revenue by Division - Current Month: The percentage breakdown of total retail revenue across divisions within your organization for the current month.
- Retail Revenue by Division - YoY: Comparison of retail revenue for each division versus the same month last year.
- Wholesale Cost by Division - YoY: Comparison of whoelsale costs for each division versus the same month last year.
Top 10 Advertisers by Change Percentage
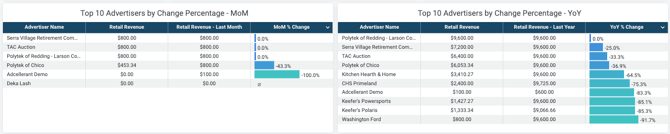
These two tables show you the top 10 advertisers with the largest month-over-month or year-over-year revenue percentage change.
Advertiser Churn
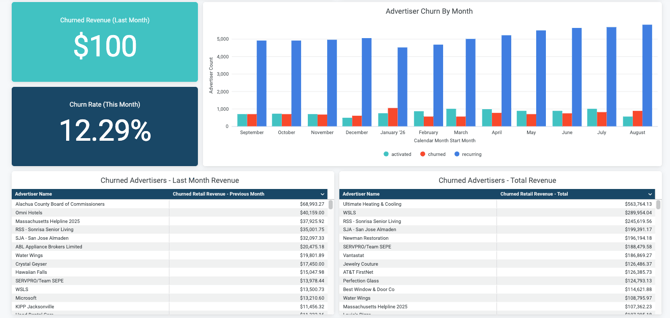
Churned advertisers are classified as advertisers that had billable revenue last month but does not have billable revenue this month.
Churn rate is comparing the number of active advertisers to the number of advertisers who have churned.
- Churned Revenue (Tile): The total amount of churned retail revenue for last month.
- Churn Rate (Tile): The overall advertiser churn percentage across your organization or selected division for the current month.
- Advertiser Churn by Month (Chart): This chart categorizes revenue into three buckets: activated, churned, or recurring monthly, and displays it by month.
- Churned Advertisers - Last Month Revenue: Identify advertisers that stupped running this month and see their retail revenue they generated last month.
- Churned Advertisers - Total Revenue: See your churned advertisers along with their lifetime total retail revenue contribution.
Retail Revenue by Advertiser by Month

With this table, see the retail revenue for each advertiser by month. You can also see when revenue drops for each advertiser.