
An overview of recency reporting in Ui.Marketing
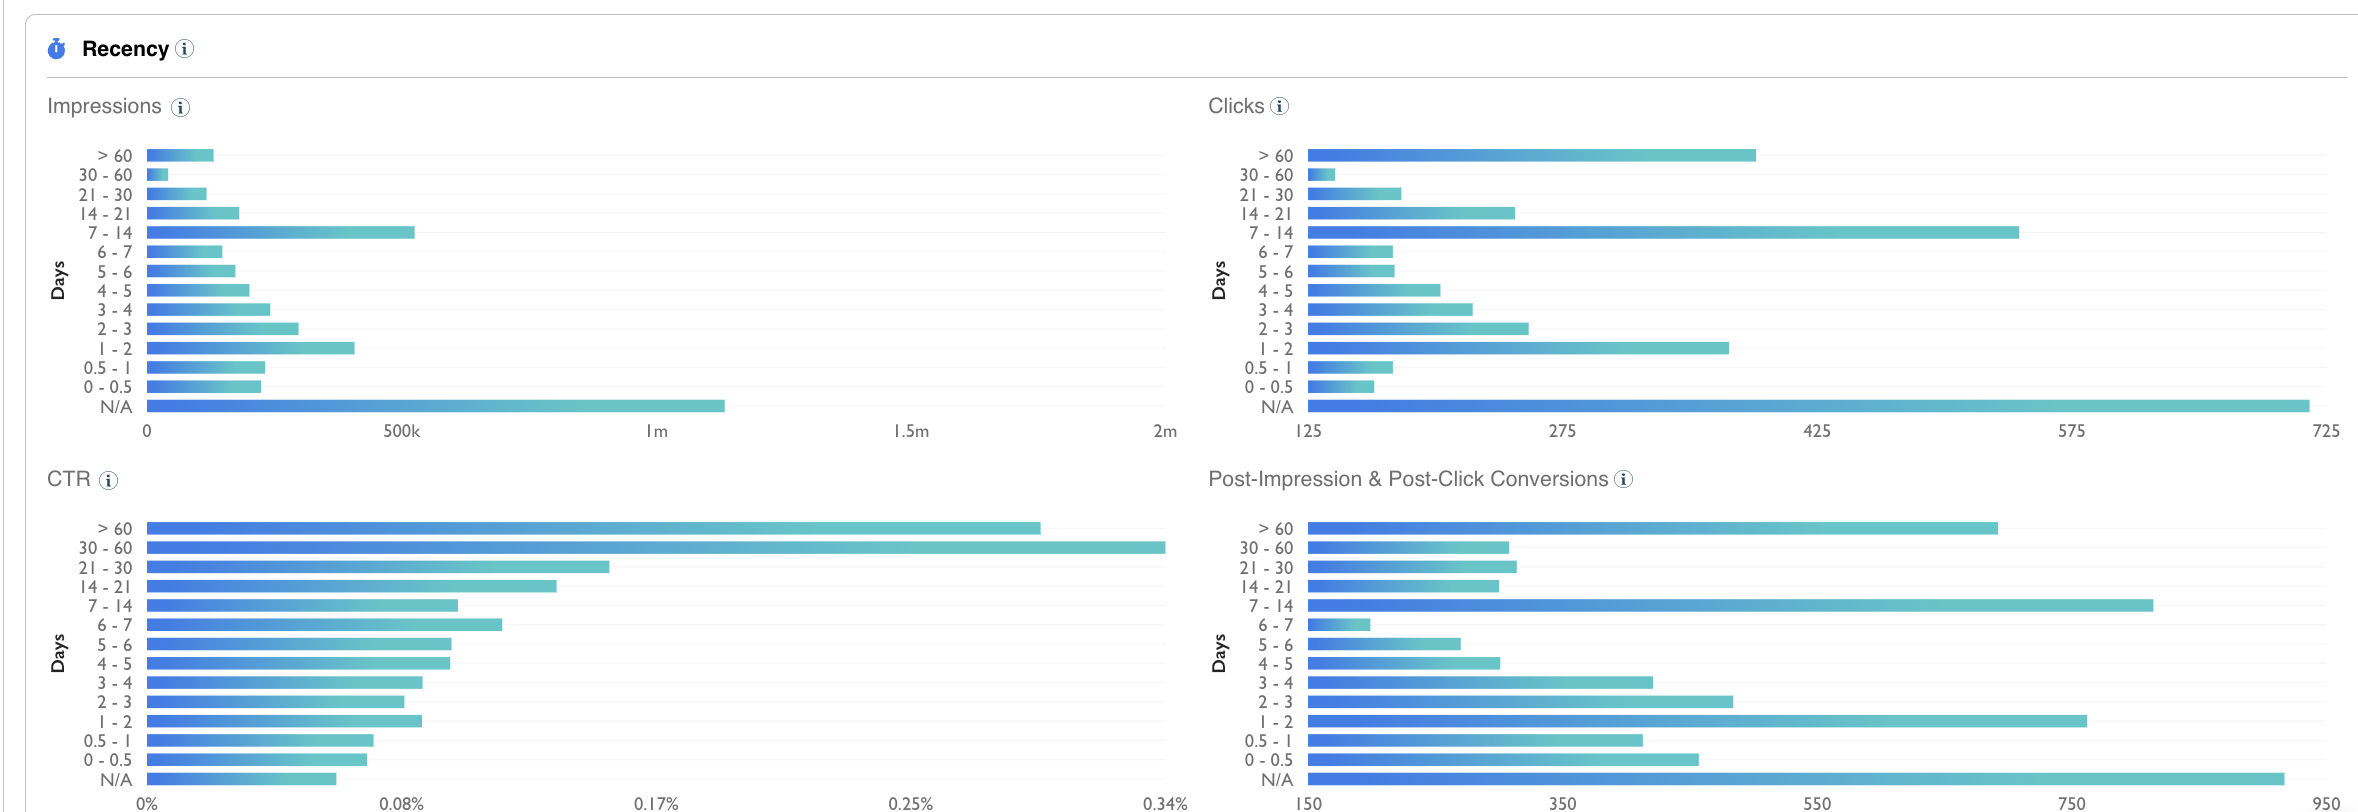
Recency reporting provides data on how long targeted users have belonged in audience segments.
Best explained by an example: An advertiser is trying to target users looking to buy a new bicycle. If they were looking at the impression box, they would know that impressions are best served when users have been looking for a bike for 7-14 days (meaning they have belonged to that targeting segment for 7-14 days) When looking at the conversion chart, they would see that people who have been looking for a bike for 7-14 days are most likely to convert.
Please note...
-
This will only show on campaigns that have data elements or campaigns that have site retargeting
-
Null data points display as N/A on the chart. Click here to learn more
Impressions
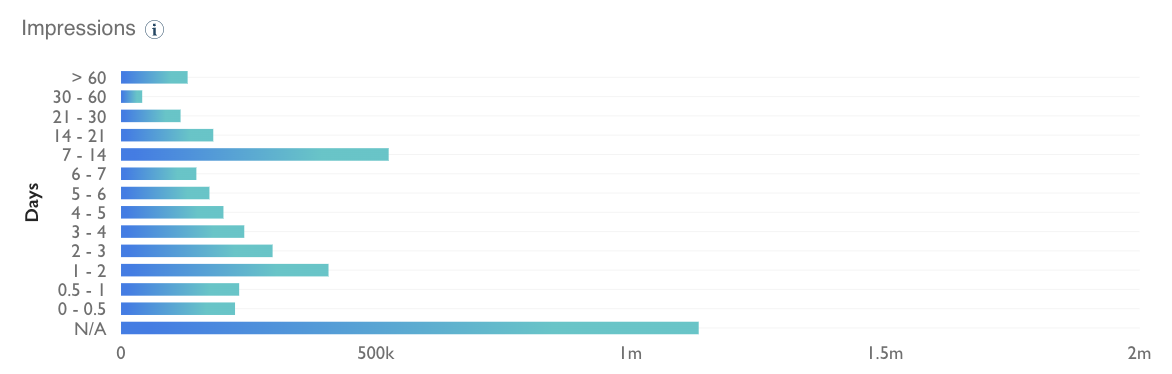
Recency by Impressions is a measurement of the number of impressions served to users who have been in a data segment for a specific amount of time. Using the example in the chart, when hovering over the 4-5 date range it means that users who have been in the target audience for 4-5 days have received 11,998 impressions. As you can see the 7-14 day range has the largest number of impressions, meaning users who belong to the data segment for 7-14 days generate the most impressions.
Clicks
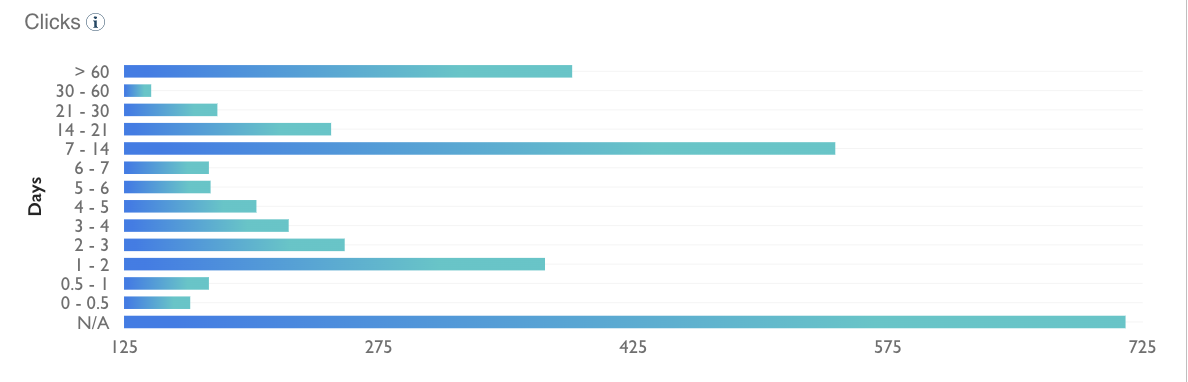
Recency by clicks is a measurement of the number of clicks served to users who have been in a data segment for a specific amount of time. Using the example in the chart, when hovering over the 7-14 date range it means that users who have been in the target audience for 7-14 days have received 40 clicks. As you can see the 7-14 day range has the largest number of clicks, meaning users who belong to the data segment for 7-14 days generate the most clicks.
CTR
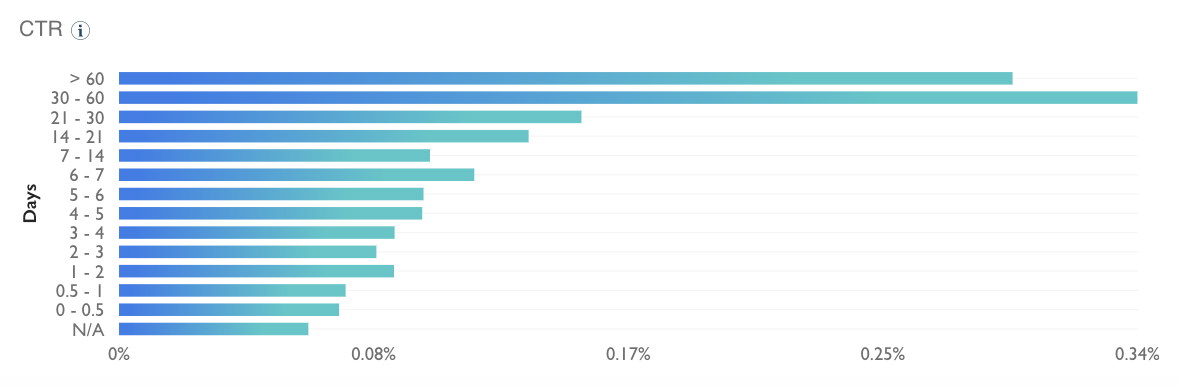
Recency by CTR (click-through rate) is a measurement of the rate of clicks per impression served to users who have been in a data segment for a specific amount of time. Using the example in the chart, when hovering over the 2-3 date range it means that users who have been in the target audience for 2-3 days have the highest click-through rate.
Conversions
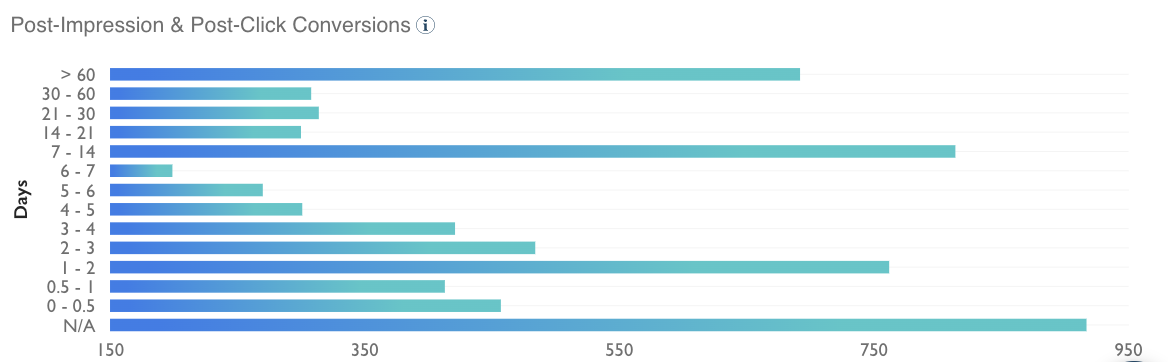
Recency by conversions is a measurement of the number of conversions served to users who have been in a data segment for a specific amount of time. Using the example in the chart, when hovering over the 7-14 date range it means that users who have been in the target audience for 7-14 days have performed the most conversions. As you can see the 7-14 day range has the largest number of conversions, meaning users who belong to the data segment for 7-14 days are most likely to convert.
On the advertiser level, users will see the total number of conversions however when on a campaign or ad group level report, you will be able to view conversions broken out by the conversion tracking label.
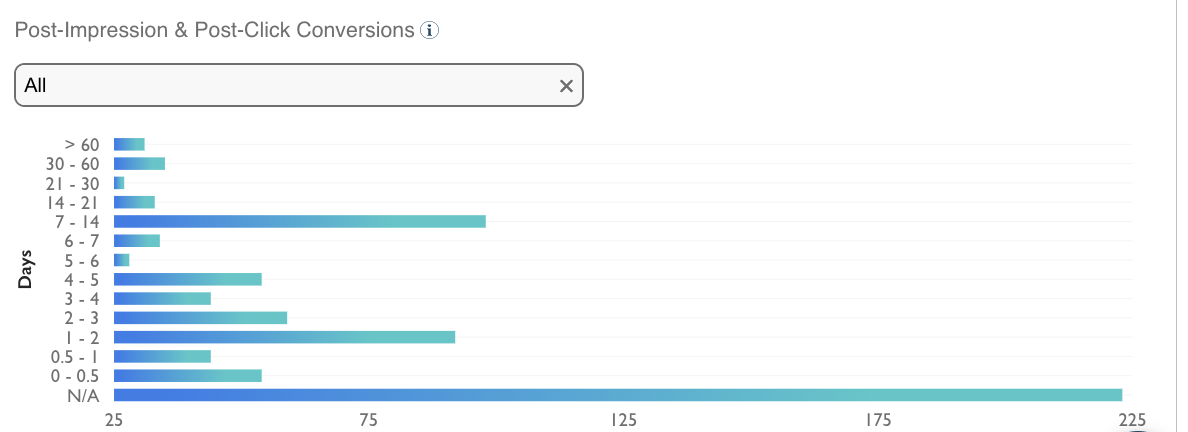
If tracking labels are set up, you will see their names of them in the dropdowns. If no labels have been configured, you will see Tracking labels 1-5