
The following information is applicable to our Display / Geofencing / Native and Streaming TV / Programmatic Video / Audio reporting in Ui.Marketing.
Display and Video Reporting Walkthrough
Reporting Charts
Snapshot
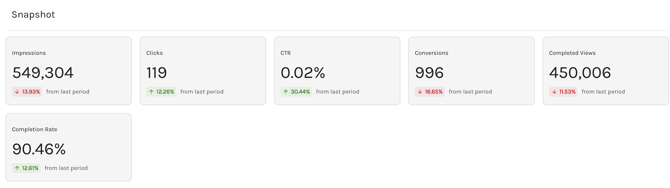
The Snapshot shows high-level metrics for the advertiser, campaign, or ad group.
Period-over-Period change can be seen within each card to see how performance has compared the previous selected date range. For example, in the screenshot above, we are viewing data for the past 14 days and we have seen a 12.26% increase in clicks compared to the previous 14 days from our date range.
Data by Time Frame
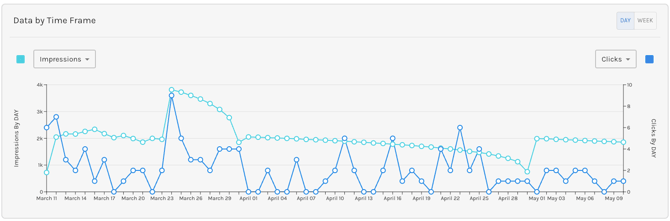
Data by Time Frame allows users to see reporting by day or week and compare metrics by clicking the drop-downs. In the screenshot above, we are comparing Impressions vs Clicks over time.
Performance by Campaigns & Ad Groups

The Performance by… table allows users to see and compare reporting across campaigns or ad groups. Users can click on the name of the campaign or ad group to review reporting specific to that item.
Geography
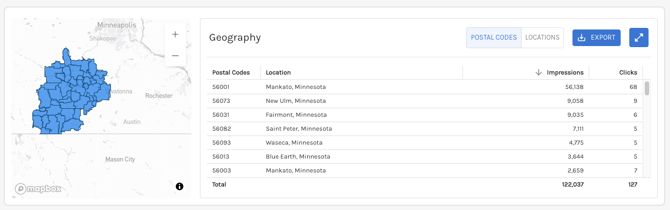
With Geography, users can see which zip codes or cities their ads are being served. To view reporting by city, a user just clicks on “Locations” in the top right-hand corner of the chart.
The map can be zoomed in/out and can be dragged.
Conversions

The Conversions chart breaks out the number of post-impression and post-click conversions for the advertiser, campaign, or ad group that the user is viewing. Conversions are set up when the campaign is set up and provided by the partner/advertiser.
Post Impression Conversions. These are conversions that happened after a user saw the ad and then completed a conversion.
Post Click Conversions. These are conversions that happened after a user saw the ad, clicked the ad, and then completed a conversion.
Top Performing Channels (Display Only)
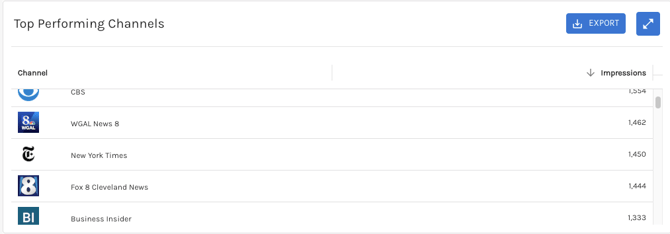
The Top Performing Channels chart is available for Display / Geofencing / Native reports and it shows how many impressions were shown for a specific ‘Brand’ or ‘Channel’.
ℹ️ You may see Other as a channel; this is simply the rest of the impressions that were served to a channel that we have not manually set up in our channel reporting on the back end.
Publisher Name (Video Only)
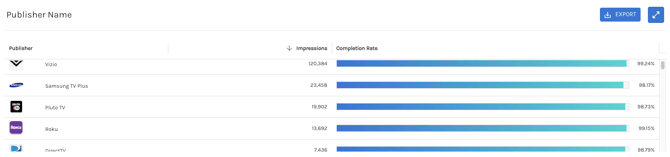
The Publisher Name report will show how many impressions and the completion rate were shown for a specific ‘Publisher’, as classified by TTD for Streaming TV / Programmatic Video / Audio only.
Device Type
The Device Type chart showcases which devices the ads have served on. The chart varies slightly depending on if you are viewing Display vs Video.
Display
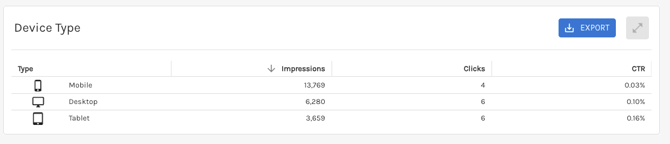
For Display campaigns, users can view the impressions, clicks, and CTR for each device type.
Video
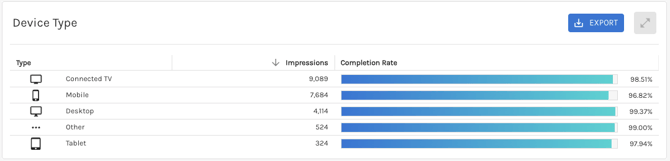
For Video campaigns, users can view the impressions and completion rate for each device type.
Performance by Creative
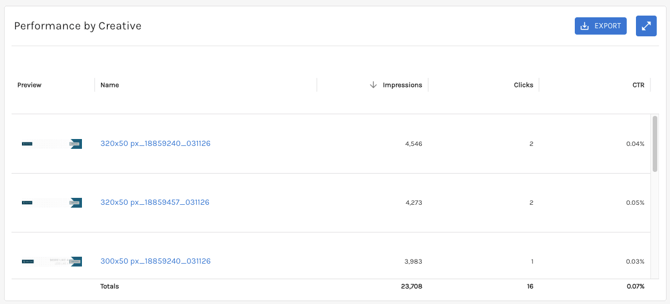
With the Performance by Creative chart, users can see performance by each piece of creative running during the selected date range.
Users can click on the image or video icon to preview the creatives.
Data by Users' Hour of Day
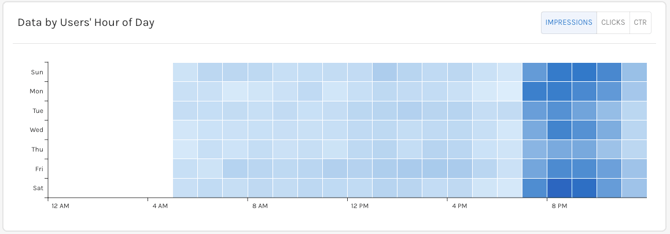
The Data by Users' Hour of Day chart allows users to see at what time and what day of the week they are getting the most impressions, clicks, or when their CTR is the highest. Users can toggle between these metrics using the buttons in the top right-hand corner of the chart.
The darker the color, the higher that specific metric is.
Data by Day (Video Only)
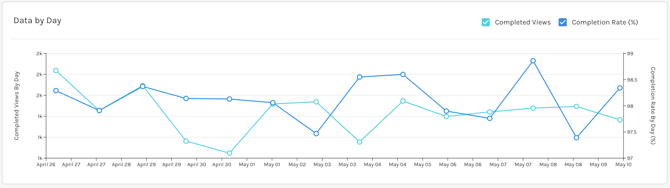
The Data by Day chart allows users to see completion rate and completed views over time on the same chart.
Audience
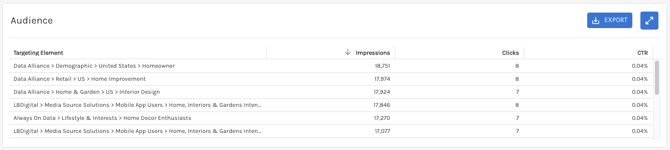
The Audience table shows all the audiences our team has targeted within TTD for this advertiser, campaign, or ad group.
This chart will break out each individual targeting element and its corresponding impressions, clicks, and CTR for display.
If a user is viewing video campaigns, you will only see the targeting elements, no additional metrics. This is because not all impressions for STV blends are served exclusively to audience targeting. This was a deliberate choice to present our blended products in a specific way, ensuring that partners don’t see that not all impressions are directed to their audience segments.
Please note that the audience report may show more total impressions than the other reports as users can fall into more than one bucket of targeting.
Recency
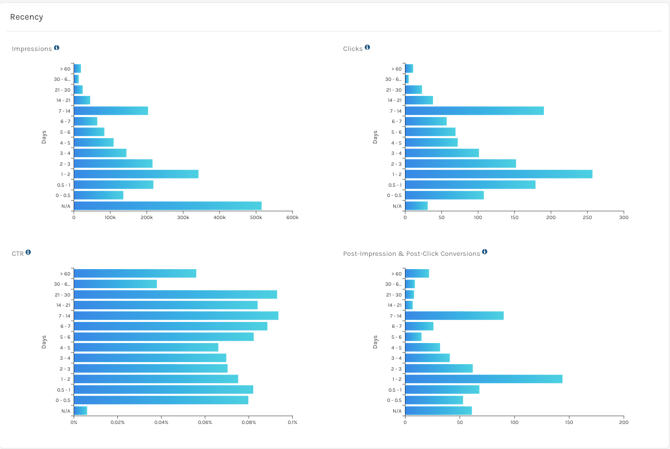
Recency reporting provides data on how long targeted users have belonged in audience segments. To learn more about Recency, visit this page.