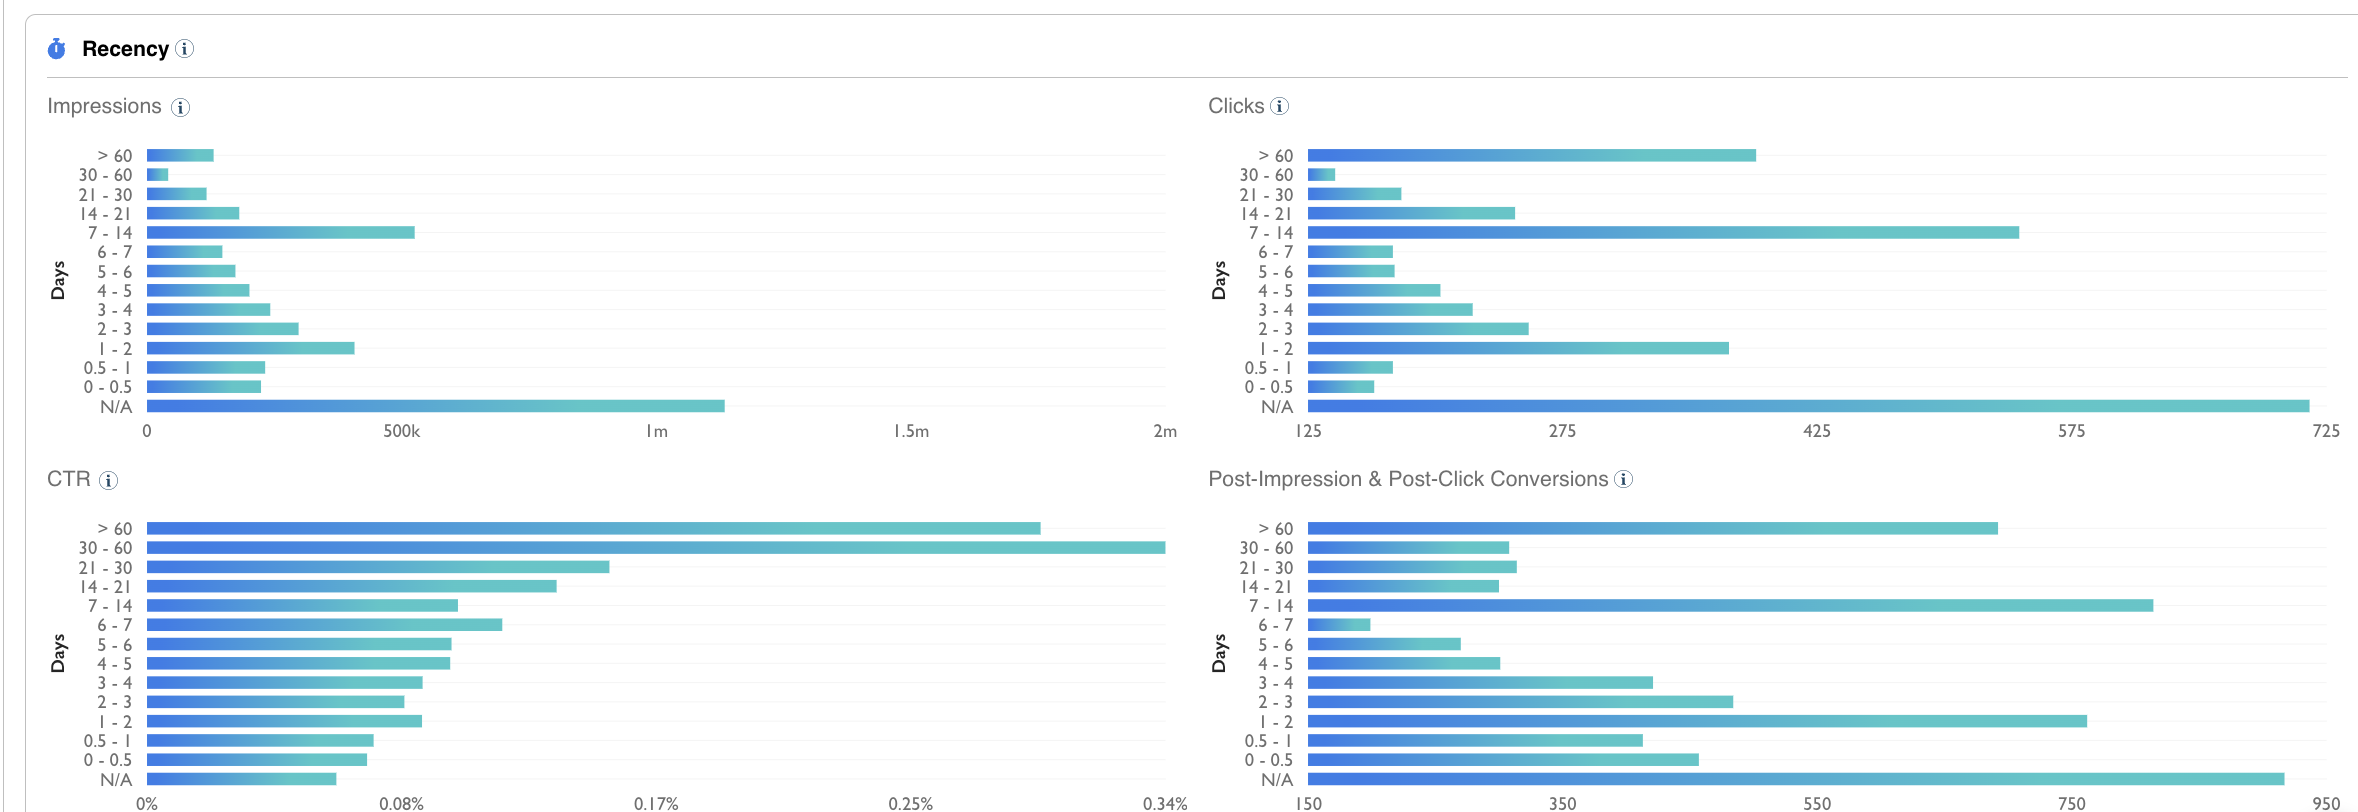
Recency reporting provides data on how long targeted users have belonged in audience segments.
Best explained by an example: An advertiser is trying to target users looking to buy a new bicycle. If they were looking at the impression box, they would know that impressions are best served when users have been looking for a bike for 7-14 days (meaning they have belonged to that targeting segment for 7-14 days). When looking at the conversion chart, they would see that people who have been looking for a bike for 7-14 days are most likely to convert.
Please note...
-
This will only show on campaigns that have data elements or campaigns that have site retargeting.
-
Null data points display as N/A on the chart. Click here to learn more
Impressions
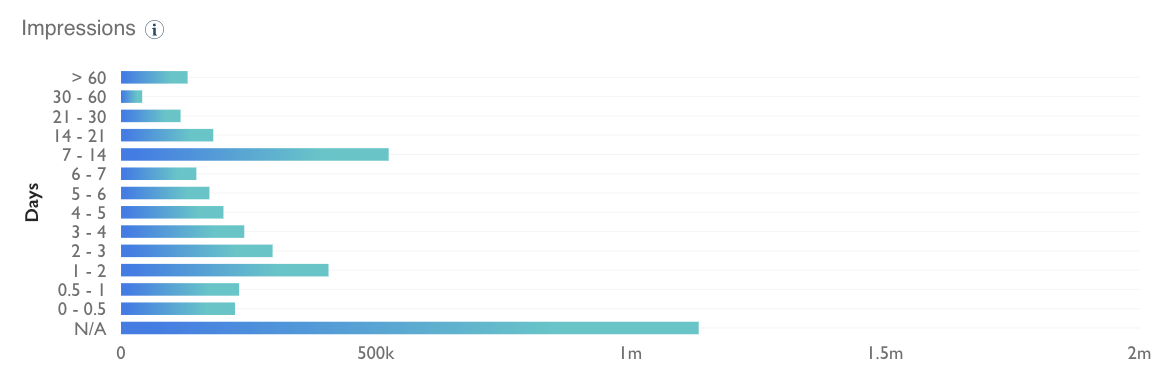
Recency by Impressions measures the number of impressions served to users who have been in a data segment for a specific time. Using the example in the chart, when hovering over the 4-5 date range, users who have been in the target audience for 4-5 days have received 11,998 impressions. As you can see, the 7-14 day range has the most significant number of impressions, meaning users who belong to the data segment for 7-14 days generate the most impressions.
Clicks
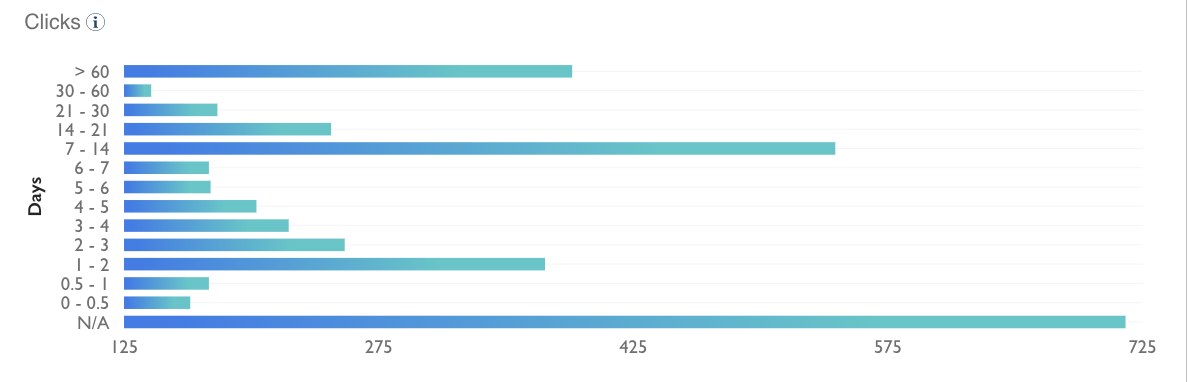
Recency by clicks is a measurement of the number of clicks served to users who have been in a data segment for a specific time. Using the example in the chart, when hovering over the 7-14 date range, users who have been in the target audience for 7-14 days have received 40 clicks. As you can see, the 7-14 day range has the most significant number of clicks, meaning users who belong to the data segment for 7-14 days generate the most clicks.
CTR
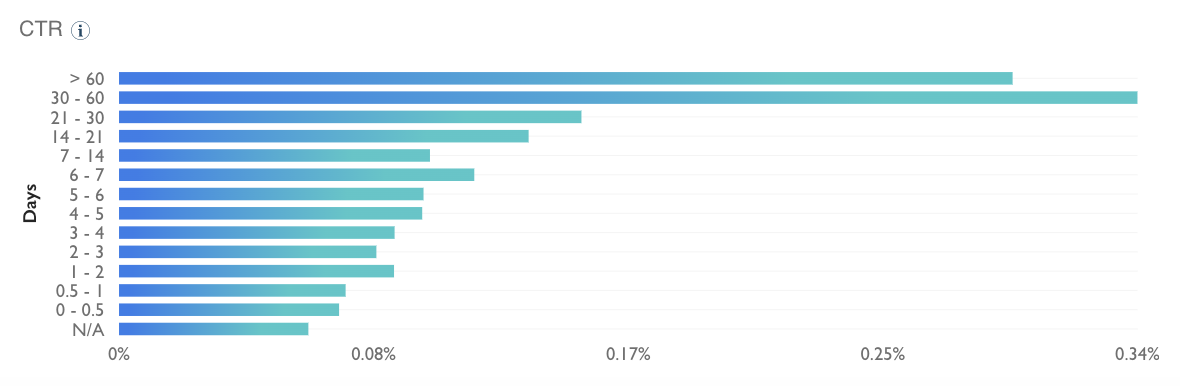
Recency by CTR (click-through rate) measures the rate of clicks per impression served to users who have been in a data segment for a specific time. Using the example in the chart, when hovering over the 2-3 date range, Users who have been in the target audience for 2-3 days have the highest click-through rate.
Conversions
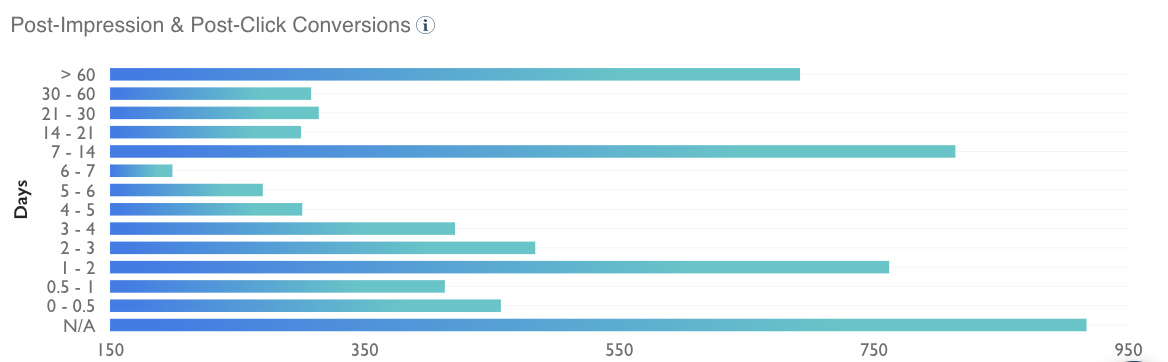
Recency by conversions is a measurement of the number of conversions served to users who have been in a data segment for a specific time. Using the example in the chart, when hovering over the 7-14 date range, it means that users who have been in the target audience for 7-14 days have performed the most conversions. As you can see, the 7-14 day range has the most significant conversions, meaning users who belong to the data segment for 7-14 days are most likely to convert.
On the advertiser level, users will see the total number of conversions; however, when on a campaign or ad group level report, you can view conversions broken out by the conversion tracking label.
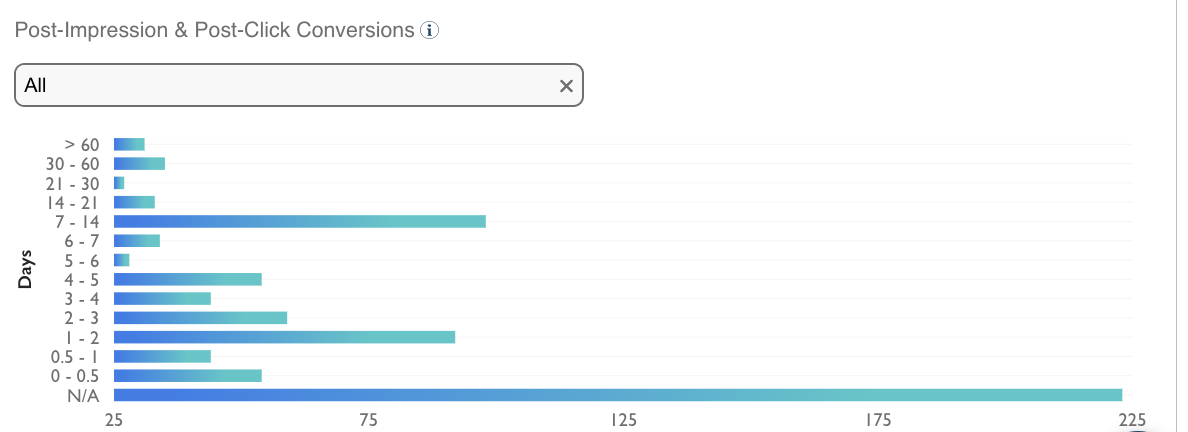
If tracking labels are set up, you will see their names of them in the dropdowns. If no labels have been configured, you will see Tracking labels 1-5
What is Recency?
Recency is defined as the amount of time since a user was last added to an audience.
It’s a matter of understanding when data was last created. For example, the last time a user was on your website. If a user was on the site 30 minutes ago vs. 30 days ago, the retargeting strategy and chances of converting are highly dependent on that recency time frame. Recency for 3rd party data refers to the latest timestamp for a user’s inclusion in an audience – it’s the last time the external provider pushed us that user.
Here are some definitions as it relates to the specific grains in reporting:
-
Event Recency Bucket Start (in minutes): Beginning of the event recency time frame being measured (for example, zero minutes, 720 minutes)
-
Event Recency Bucket End (in minutes): End of the event recency time frame being measured (for example, 720 minutes, 1440 minutes)
-
Event Recency Bucket Name: Name of the event recency bucket used in reporting (for example, 0-0.5 days)
-
Recency Group: Name of the recency bucket used in reporting
-
Recency Group Start (in minutes): Beginning of the recency time frame being measured
-
Recency Group End (in minutes): End of the recency time frame being measured