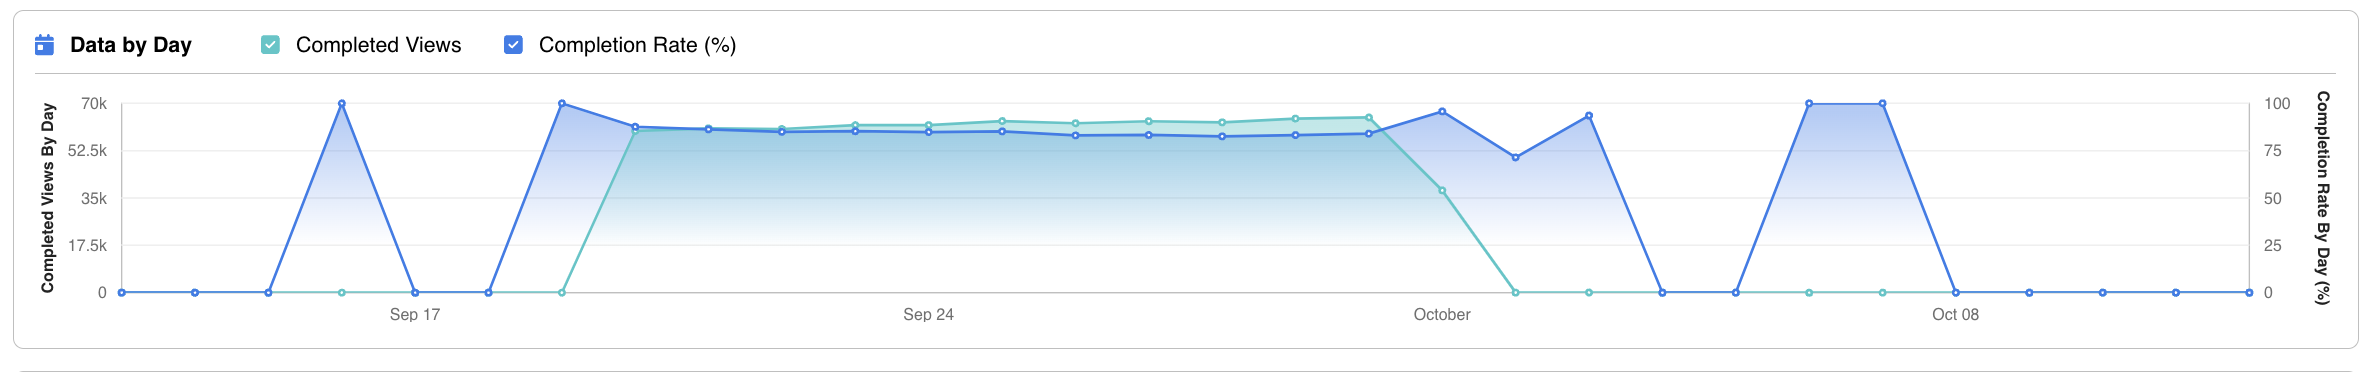
Use the Data by Day line chart to see the number of Completed Views and the Completion Rate Percent for every day within the date range selected.
- This chart is only available when the Product is Video.
- Use the checkboxes at the top of the chart if you would only like to see one of the data points
- The teal line indicates the number of completed views per day for the advertiser, campaign, or ad group selected.
- The blue line indicates the completion rate per day for the advertiser, campaign, or ad group selected.

- Hover over each data point to see the specific number of Completed Views or Completion Rate Percent for that day.
How is the completion rate calculated?
Completion Rate: The completion rate is calculated by taking the total number of Player Completed Views divided by the total number of Player Starts. This is then multiplied by 100 to be displayed as a percentage.
Player Starts vs Impressions: An impression is counted as soon as the ad is loaded on the page and the player starts when the video is actually played. A player could start/play the video multiple times and it still counts as one impression.
