How to access Local SEO Reporting?
In-depth guide for Local SEO reporting within Ui.Marketing
Table of Contents
Walkthrough
Local SEO Charts
Advertiser Snapshot
The Local SEO Snapshot will display the following performance data and PoP metrics for your selected date range:
- Total Google Impressions
- Total Google User Actions
- Average Google Rating
Google Listing Impressions

The Google Listings Impressions line graph allows users to compare an advertiser's Google Search Impressions vs. Google Map Impressions for the user's selected date range.
- At the top of the graph, we will display the overall totals for Google Search and Google Map Impressions.
- Users can hover to display the specific total for each dot (date) on the line graph.
Performance by Location

The Performance by Locations table lets users view key Local SEO metrics by location and compare individual performance by location.
- If an advertiser’s location contains data for a metric, the column will show with relevant data for:
- Calls
- Website Visits
- Direction Requests
- Order Now
- Book Appointments
- Food Menu Clicks
- Clicking on a location address will navigate you to the location-specific Local SEO Reports
- Customize the columns to hide and show specific Local SEO data points
- View overall totals for each action across individual locations
- Sort columns by ascending/descending order
- Export Performance by Location details to .csv
Google Listing Actions

The Google Listings Actions graph offers a detailed line graph that tracks all Local SEO Google Actions for Calls, Website Visits, Direction Requests, Book Appointments, Order Now, and Food Menu Clicks on a monthly basis
- At the top of the graph we will display the overall totals for Calls, Website Visits, Direction Requests, Book Appointments, Order Now, and Food Menu Clicks
- Ability to select/de-select actions to show/hide Google Actions on line graph
- Users can hover to display the specific total for each dot (date) on the line graph
Top-Tier Listings

Top-tier listings help strengthen your online authority and help your business appear in the Local Pack and Maps. You can easily see the number of listings your business has, which ones, and their status.
💡 Listing Statuses
🟢 Synced: The listing is successfully syncing business information to the publisher site.
🟠 Processing: The listing is in its initial sync process to the publisher site.
🔴 Not Synced: We are unable to sync or submit information to the publisher site. Please reach out to your campaign manager for further details.
Opted Out: There is no connection between your business and this publisher site.
Top Google Search Impressions

The Google Search Term Impressions list provides a detailed view of how a business is performing in search by displaying individual raw search terms alongside the total impressions for each.
This tool enables users to understand which keywords are driving visibility in Google search results, helping users optimize a business’ SEO strategy, refine content, and target the most effective search terms to attract and engage an audience.
- Highest performing Search Term Impressions will display at top of list
- Sort by ascending/descending order for each column
- View total counts for each search impression
- View overall Total Count for all Search Term Impressions
- Ability to export Google Search Impressions List to .csv
This list will only populate with a date range of 90 days or more. It will not populate for anything less than 90 days.
Review Overview

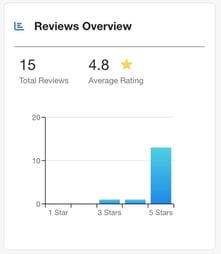
The Review Overview chart provides a clear snapshot of a business’s online reputation by showcasing the total number of reviews and the average 5-star rating. The bar chart breaks down customer feedback by displaying the distribution of ratings from 1 to 5 stars, allowing users to quickly identify trends in customer satisfaction.
- The Review Overview displays the total Reviews & Average Rating for the selected date range.
- The x-axis will display a section for each star rating.
- The Y-axis will display the count of ratings.
- A bar will display if there is data contributing to that rating. Users are able to see how many reviews are contributing to each star rating.
- If a user hovers over a specific rating bar, it will show the specific total number of reviews for that rating.