
An overview of Google Ad Manager reporting in Ui.Marketing
Accessing Google Ad Manager (GAM) Reporting
Google Ad Manager (GAM) Reporting Charts
Snapshot
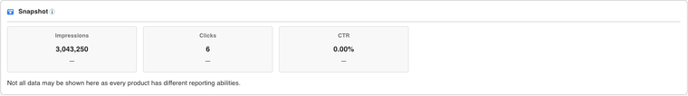
The Snapshot Chart will show a high-level overview of the Advertiser, Campaign, or Ad Group you are viewing.
The snapshot boxes will give a high-level summary of an advertiser, campaign, or ad group's performance. The boxes that show will vary per product.
Period-over-period data is also available in this report, which shows how your performance compares to the performance of a previous time frame.
The period-over-period analysis (PoP) compares the data in the date ranges selected to the same period of time in the past. For example, if your date ranges are Aug 1-31 the period-over-period analysis would be comparing data that ran July 1-31 (the previous 31 days)
Please note that this data can be shown or hidden in the shareable link and PDF.
Data by Timeframe
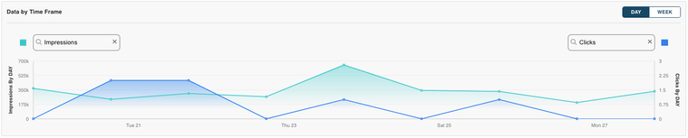
The data by time frame chart allows users to see their performance on a daily or weekly basis across the time frame selected.
Click the dropdowns to choose the data points to compare. In addition, you can toggle to view the metrics broken out by week if you are viewing a report longer than 21 days.
Performance by Campaign
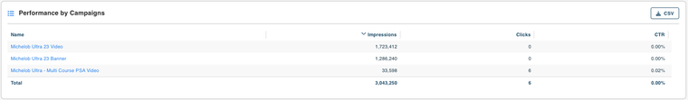
The performance table will give a breakdown of the underlying campaigns (Google Ad Manager Orders) or ad groups (Google Ad Manager Line Items) based on the selections made in the sidebar. The performance table does change based on product and other selections made in the sidebar.
-
Performance by Campaign (Advertiser View)
-
Performance by Ad Groups (Campaign View)
-
Performance by Ad Group (Ad Group View)
Performance by Campaign
The performance by campaign table can be viewed on the advertiser level and shows how the individual underlying campaigns (Google Ad Manager Orders) under that advertiser are performing. Only the campaigns for the selected product will show, and the columns displayed will change based on the product selected.
Performance by Ad Groups
The performance by Ad Groups table can be viewed on the campaign level and shows how the underlying ad groups (Google Ad Manager Line Items) under that campaign (Google Ad Manager Order) are performing. Only the ad groups for the selected product will show, and the columns displayed will change based on the product selected.
Performance by Ad Group
The performance by Ad Group table can be viewed on the ad group (Google Ad Manager Line Item) level and shows how that specific ad group (Google Ad Manager Line Item) is performing. Only the ad group (Google Ad Manager Line Item) for the selected product will show, and the columns displayed will change based on the product selected.
Geography
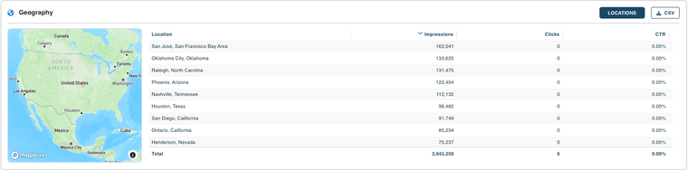
The Geography/Locations reporting feature allows you to track the performance of your campaigns in different locations and demographics. With various customization options, you can easily tailor the view to your preferences.
Locations: Data is grouped by city and state
Navigating the Map:
The map displayed on this component is interactive and can be moved around based on user preference.
-
-
To zoom in and out of the map, ensure your cursor is hovering over the map, and use your mouse scroll to adjust the view.
-
To move the map around, click on an area of the map, and while holding the selection drag and drop the map around.
-
Geography Table:
The table below the map will show all of your locations with corresponding impressions, clicks, and CTR per city and state.
-
-
The table is scrollable, users can sift through all locations and data points.
-
Totals for all impressions, clicks, and click-through rates for the selected time period are displayed at the bottom of the chart.
-
Each column can be sorted, with the default sort being impressions.
-
Performance by Creative
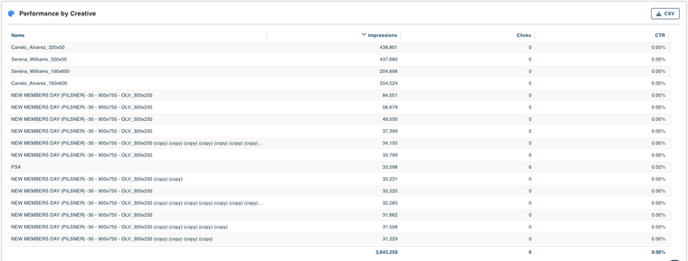
Creative Reporting is used to view all creatives running during the time period selected for that specific advertiser, campaign, or ad group and product selected in the sidebar. Currently, Google Ad Manager does NOT have creative previews.
Download Report PDF
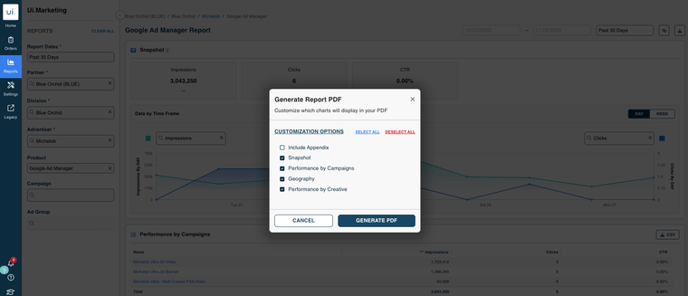
Users can download the report PDF and customize the charts that are shown. Excess data points will be rolled over to an appendix.
Report Shareable Link
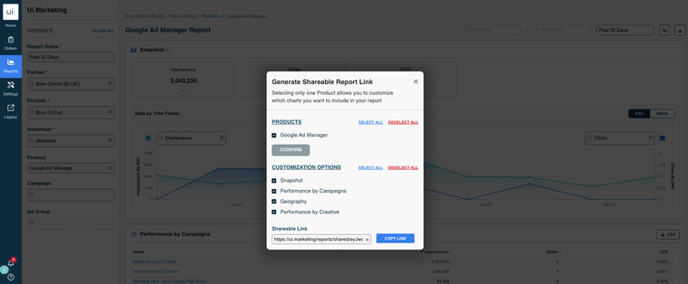
Users can generate a shareable link that can be sent to users. Shareable links do not require a login and do not expire.